Products
What's New
News Articles
Have a Question?
Social Networking


Products
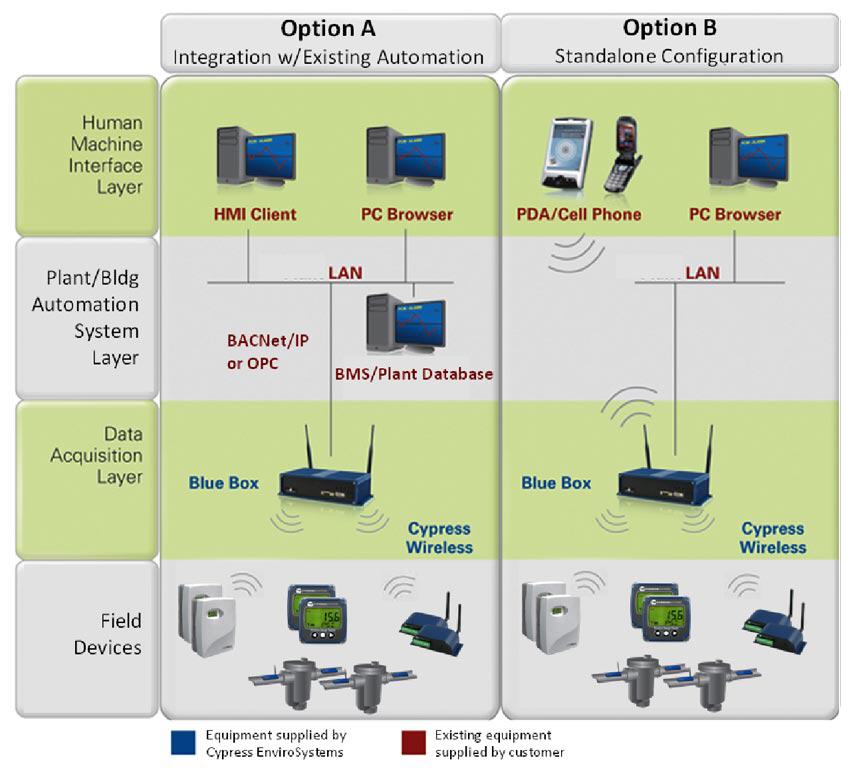
Industrial Automation Wireless Architecture
All of Cypress Envirosystems’ products fit into an overall seamless system to enable remote monitoring and control of existing, manual, non-communicating field devices. Our layered architecture allows both standalone functionality as well as easy integration with existing plant networks and automation systems.
Field Devices
- Wireless Pneumatic Thermostat (WPT) – enables remote zone monitoring and setpoint control of the pneumatic HVAC system
- Wireless Gauge Reader (WGR) – reads analog dial gauges and transmits reading wirelessly
- Wireless Transducer Reader (WTR) – reads transducers and transmits reading wirelessly
- Wireless Steam Trap Monitor (WSTM) – enables remote monitoring of steam trap condition
Data Acquisition and Control Layer
- Green Box Controller (GBC) gathers and stores data from the wireless field devices and provide web-based control from anywhere.
Automation System Layer
- Built-in software and database in the Green Box Controller has optional BACnet/IP, OPC and SECS/GEM interface to integrate with existing plant automation systems from Honeywell, Johnson Controls, Siemens, TAC, Invensys, GE, Rockwell Automation, Emerson etc.
Human Machine Interface Layer
- Includes web and text message based user interfaces for client PC’s or cell phones to query readings, graph history, and send set point commands.