Products
What's New
News Articles
Have a Question?
Social Networking


Green Box Controller
Gathers, stores, distributes, and presents wireless data, commands, plus alarm notifications on excursions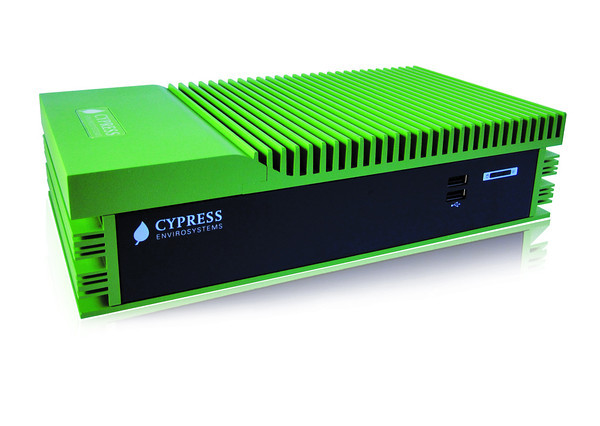
The Cypress Envirosystems Green Box Controller (GBC) is a centralized control device that collects data from and sends commands to Cypress Envirosystems field devices and enables access to data from a variety of users and interfaces.
For users with existing data management systems, it can forward data seamlessly to integrate with third-party building automation systems, SCADA or IT infrastructure using a variety of open communications protocols, e.g. BACnet, OPC, ODBC, web services. For users who do not need to connect to existing infrastructure, the GBC can also serve as a standalone front-end interface. Standard PC workstations can become operator stations simply by using a web browser. Alarm notifications may be sent to cell phones, PDAs or email.
- Data collection unit for receiving wireless data from Cypress Envirosystems field devices
- Each GBC accommodates up to 225 Cypress Envirosystems field devices
- Built in web server for easy browser access to data and trending
- Capability for local storage of data
- Uses robust and highly optimized industrial DSSS radio and protocol with antenna and frequency diversity
- BACnet and OPC interfaces for integration with existing automation systems
- Ruggedized enclosure for industrial environments
- FCC, RoHS and ETSI compliant
Part numbers and product briefs for submittals:
- GBC-820-COM: used with the Wireless Pneumatic Thermostat system (each GBC-820-COM requires one USB Hub (WPT-800-HUSB)
- GBC-820-IND: used with the Wireless Steam Trap Monitor, Wireless Gauge Reader, Wireless Transducer Reader, and Wireless Freezer Monitor (each GBC-820-IND requires one Industrial USB Hub (IND-HUB))