Products
What's New
News Articles
Have a Question?
Social Networking


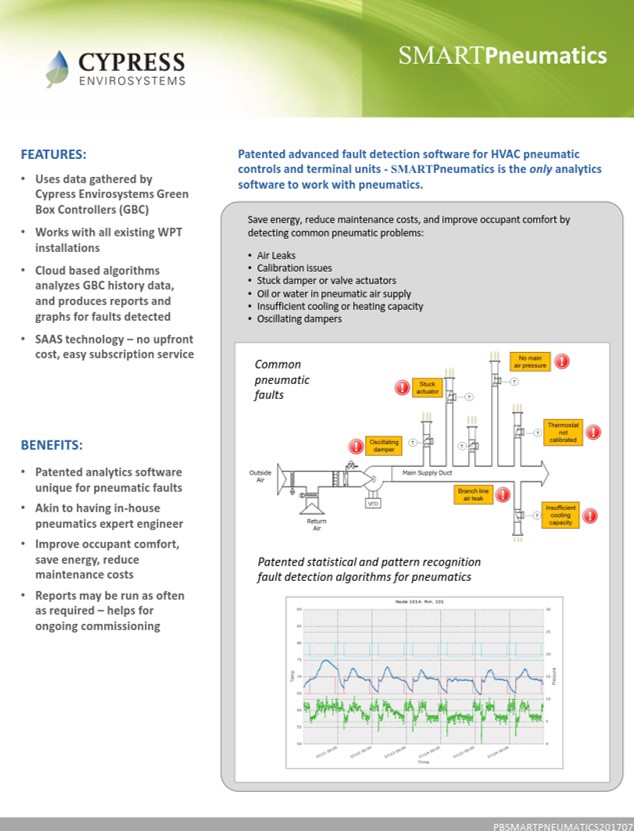
SMARTPneumatics
Advanced Fault Detection for Pneumatic Systems
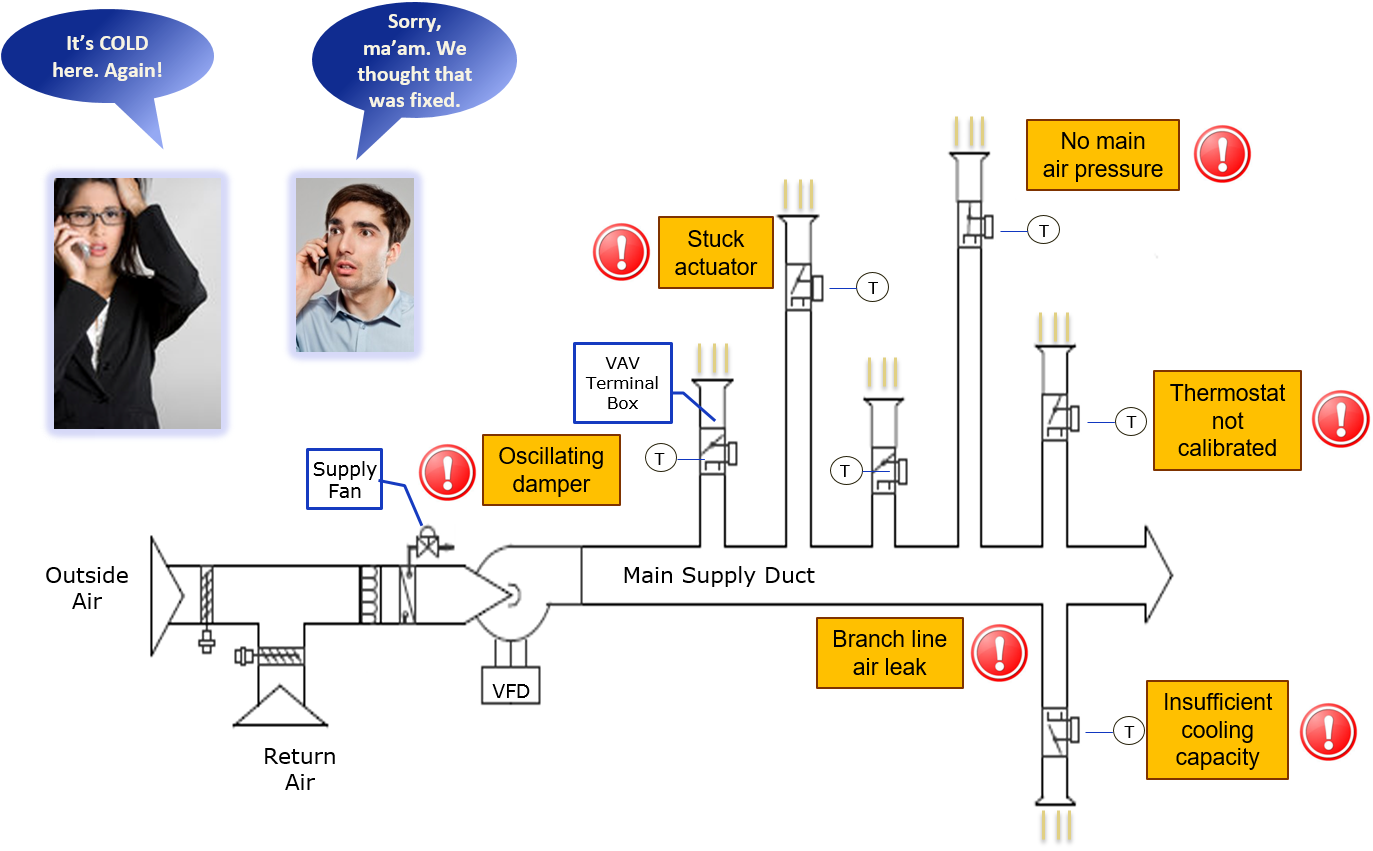
Legacy pneumatic thermostats generate no data, so building operators are blind to the issues that exist behind walls. The terminal units may have stuck actuators or the dampers may be oscillating, but no one knows because there is no information available. These problems often persist until a hot/cold call from an unhappy occupant triggers an investigation. SMARTPneumatics makes it possible for building engineers to know how each zone is performing on an ongoing basis and to prioritize maintenance work to ensure the best performance possible from the building.
Cannot see lurking issues with legacy pneumatic thermostats
Pneumatics have long been in use and are still in around 70% of buildings in North America since retrofitting with traditional rip-and-replace DDC is costly and invasive. They are very robust, but have several shortfalls compared to digital controls.
Legacy Pneumatic Thermostats
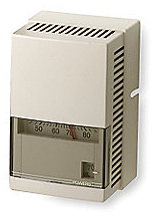
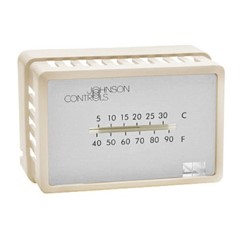
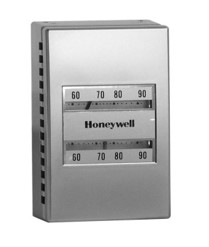
- Hard to maintain
- Waste energy
- No communication
- No visibility
- No diagnostics
- Difficult to troubleshoot
SMARTPneumatics automatically identifies and prioritizes faults conditions
The Wireless Pneumatic Thermostat generates pneumatic zone data for SMARTPneumatics to analyze. The system is able to identify and report several fault conditions associated with the terminal units and pneumatic infrastructure.
- Stuck actuators
- Oscillating dampers
- Insufficient cooling
- Supply or branch line leak
- Calibration needed
- Air system contamination
How SMARTPneumatics Works
The Wireless Pneumatic Thermostat system collects extensive sensor and operational data on zone temperatures, setpoints, occupancy modes, air pressure, etc., which is fed to the SMARTPneumatics engine.
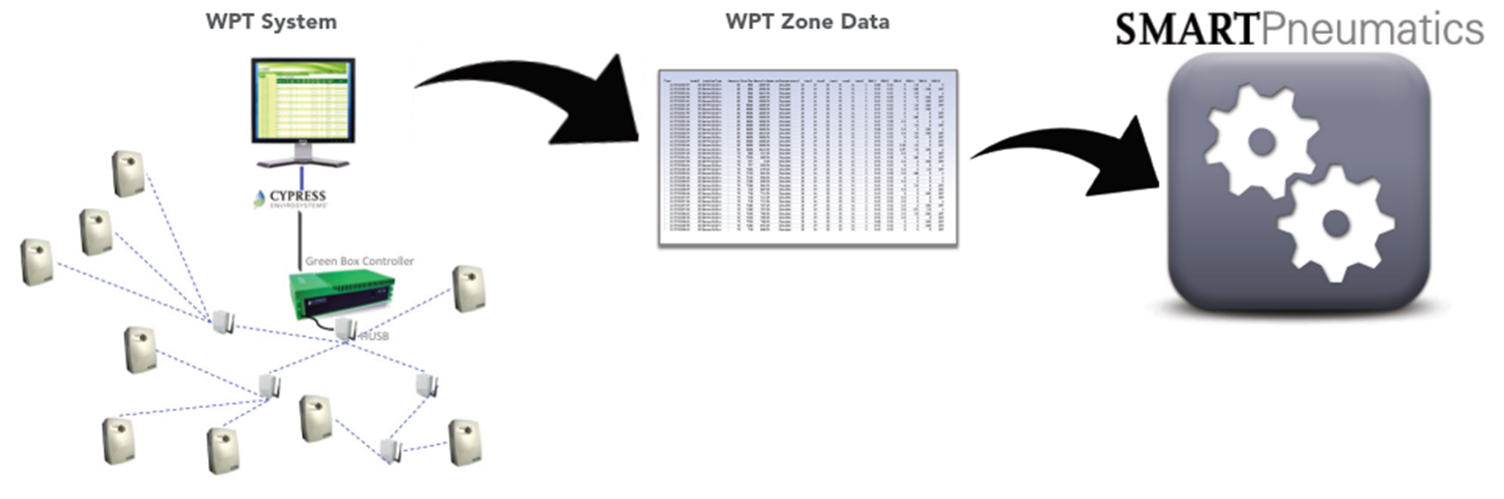
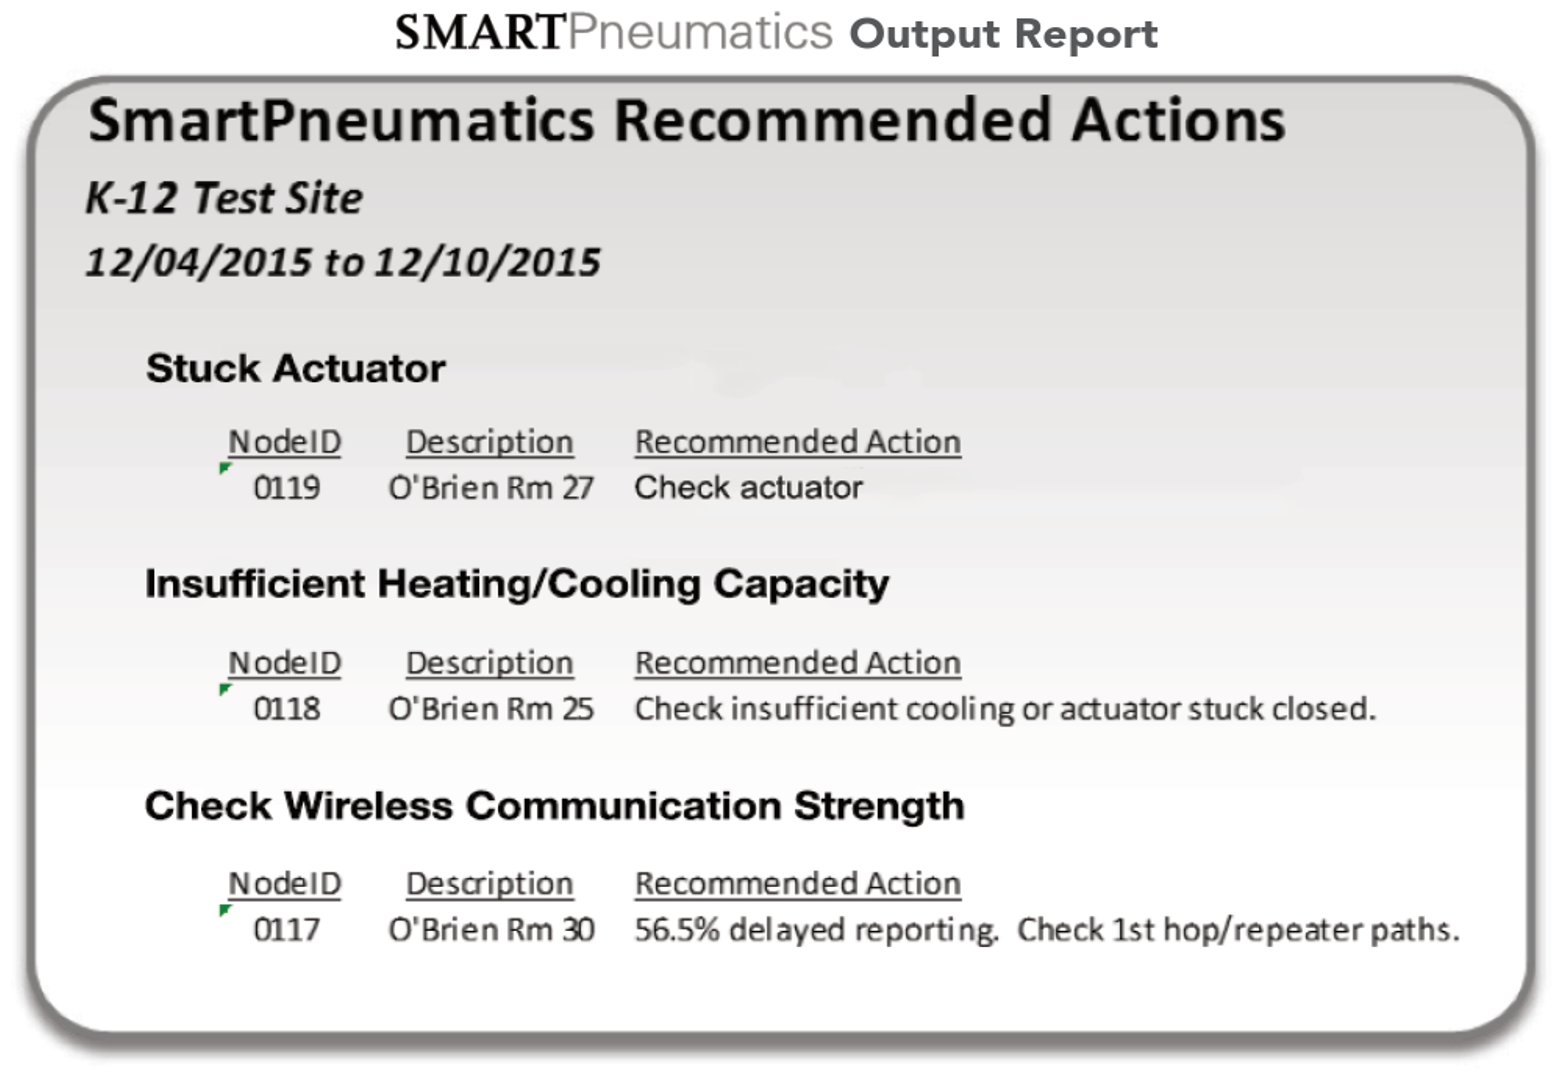
SMARTPneumatics’ patent pending analytics software performs fault detection diagnostics and produces an easy to read actionable report.
Benefits of SMARTPneumatics
SMARTPneumatics helps building operators know whether their pneumatic HVAC terminal units are working properly. When they are not, the fault detection system lets the operator know so maintenance can be prioritized and issues addressed quickly. Building engineers can use SMARTPneumatics to achieve several benefits:
- Prioritize maintenance
- Reduce hot/cold calls
- Improve occupant comfort
- Save energy
- Gain LEED Ongoing Commissioning points
- Avoid damage to equipment
SMARTPneumatics Subscribers
Subscribers to SMARTPneumatics can run their own diagnostics reports at www.smartpneumatics.com by following these simple steps:
- Download the Daily Performance Log from your Green Box Controller (See short 43-second video)
- Log into www.smartpneumatics.com
- Select Analysis to upload the Daily Performance Log and run the report
Download SMARTPneumatics PDF